Your dissertation’s numbers, done right and explained.
I help doctoral students design the study, clean the data, run the analysis and check every number before the committee does. You walk into your defense understanding all of it.
Your first consultation is free.
Create a free account, then pick a time that works for you.

Help at every stage of the dissertation
Bring me in wherever you are. Most students reach out when the proposal is due or when Chapter 4 stalls, and some only need their numbers checked.
Research design and architecture
Turn your research questions into testable hypotheses, then choose the design, variables and analysis that actually answer them.
- Research questions and hypotheses
- Choosing the right test
- Chapter 3 analysis plan
Sample size and instruments
Know how many participants you need and how your survey scales will be scored before you collect a single response.
- Power analysis
- Survey and scale scoring
- Data plan for IRB
Data cleaning
Messy exports from Qualtrics, SurveyMonkey, Excel or public databases become one clean file, with every change documented.
- Merging and reshaping
- Recoding and reverse-scoring
- Missing data
- Outliers
Codebooks and reliability
A codebook your committee can follow, scale scores built the way the instrument intends, and reliability you can report.
- Codebook
- Scale scores
- Cronbach’s alpha
Quantitative analysis
The analysis your design calls for, run carefully, with assumptions checked and results you can explain in a sentence.
- t-tests and ANOVA
- Chi-square
- Correlation
- Linear and logistic regression
- Multilevel models
- Panel data
- Interrupted time series
- Mediation and moderation
- Factor analysis
- Nonparametric tests
Tables, figures and write-up
APA 7 tables and figures, plain-language interpretation for your results chapter, and interactive reports you can click through.
- APA 7 tables
- Figures
- Results in plain language
Validation of your numbers
Already ran it yourself, or had someone else run it? I re-run it from your data, check every value and assumption, and tell you plainly what holds.
- Re-run from raw data
- Assumption checks
- Table audit
Revisions and defense prep
Handle what your chair sends back, then practice explaining every test until committee questions feel routine.
- Committee revisions
- Practice questions
- Explaining your results
Any software your program expects: SPSS, R, Stata, SAS, Python, JASP, jamovi or Excel.
A second set of eyes before your committee’s
Small reporting errors are what committees catch first. Here is the kind of check I do on a results table, with the notes I’d leave you.
| Predictor | b | SE | t | df | p |
|---|---|---|---|---|---|
| Intercept | 61.20 | 2.14 | 28.60 | 238 | .0002 |
| Self-efficacy | 4.823 | 0.91 | 5.30 | 238 | .000 |
| Charter school | −3.10 | 1.62 | −1.91 | 2381 | .057 |
- Charter school is tested with too many degrees of freedom.It’s a school-level predictor and there are only 18 schools, so its test has about 16 df, not 238. Recomputed, p is about .07, and the write-up has to match.
- A p-value is never zero.APA 7 reports anything this small as p < .001. Committees notice “.000” right away.
- This one checks out.Re-ran from your raw file and got the same coefficient, and the assumption checks hold.
Everything lives in your portal
Every client gets a private portal at app.cruzstats.com. Notes, results, files, meetings and invoices stay in one place instead of a long email thread.
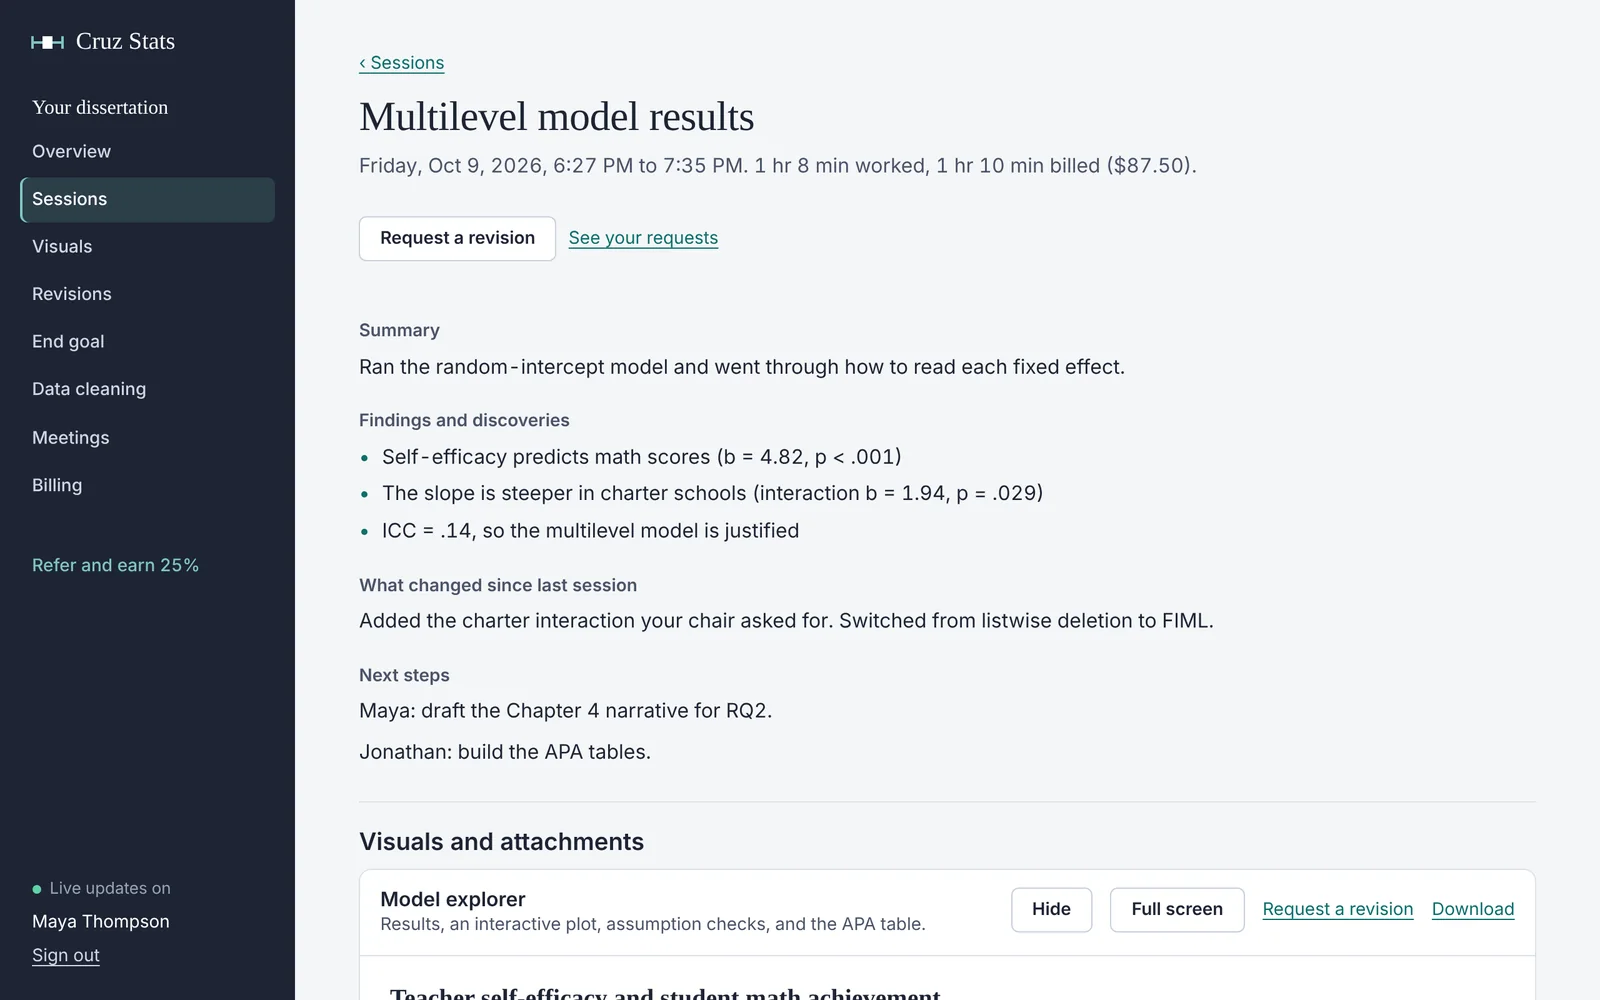
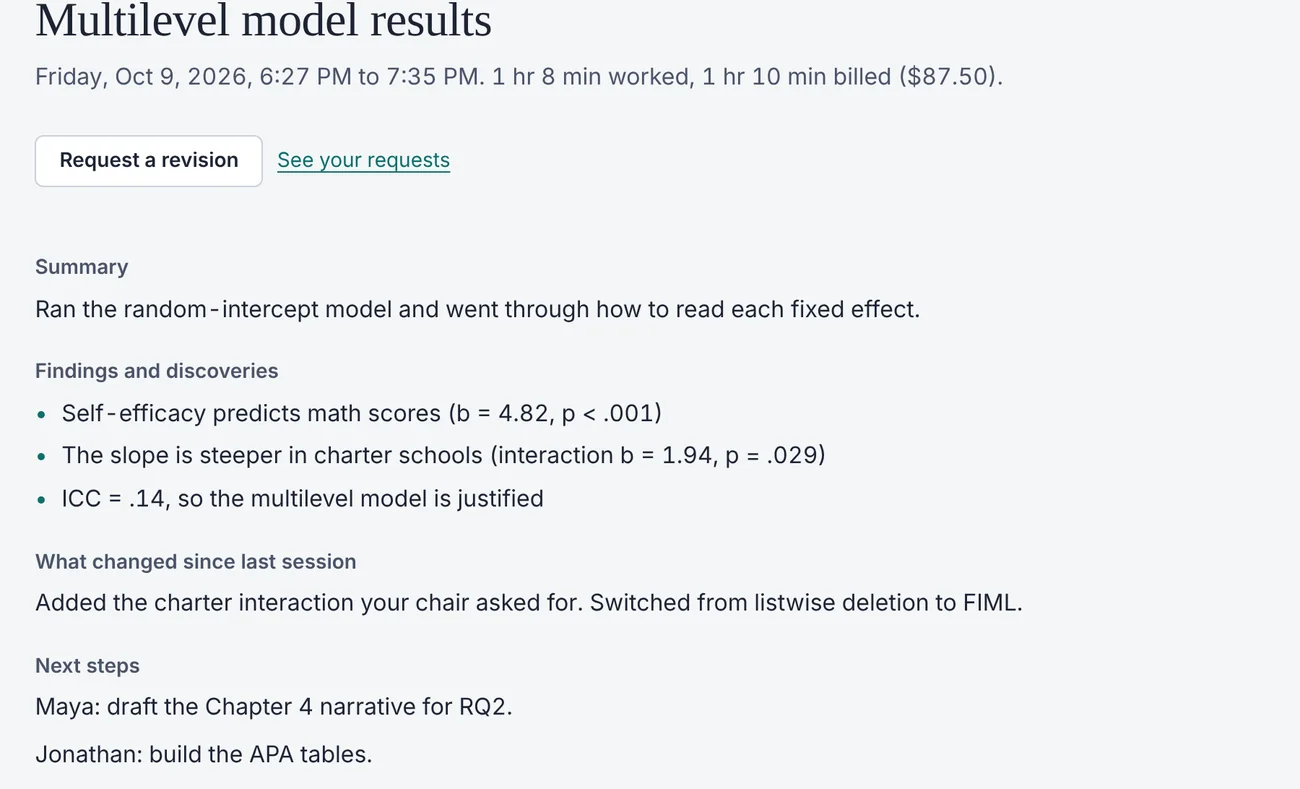
After every session: what we did, what we found, what changed and what’s next, with the time billed.
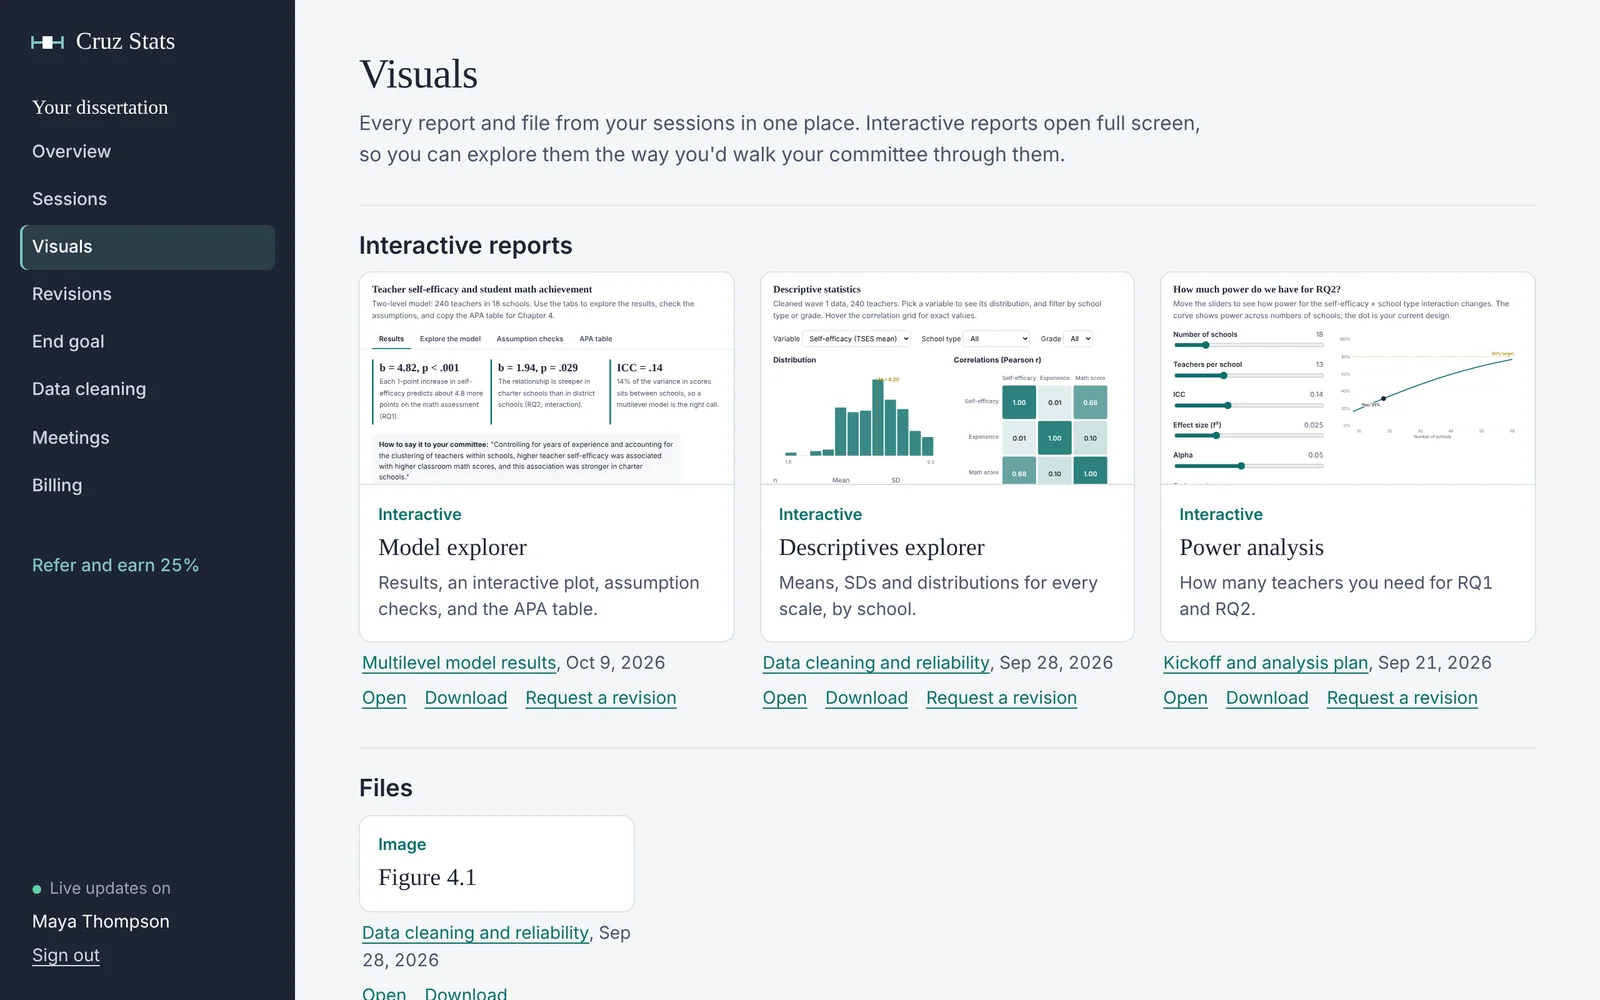
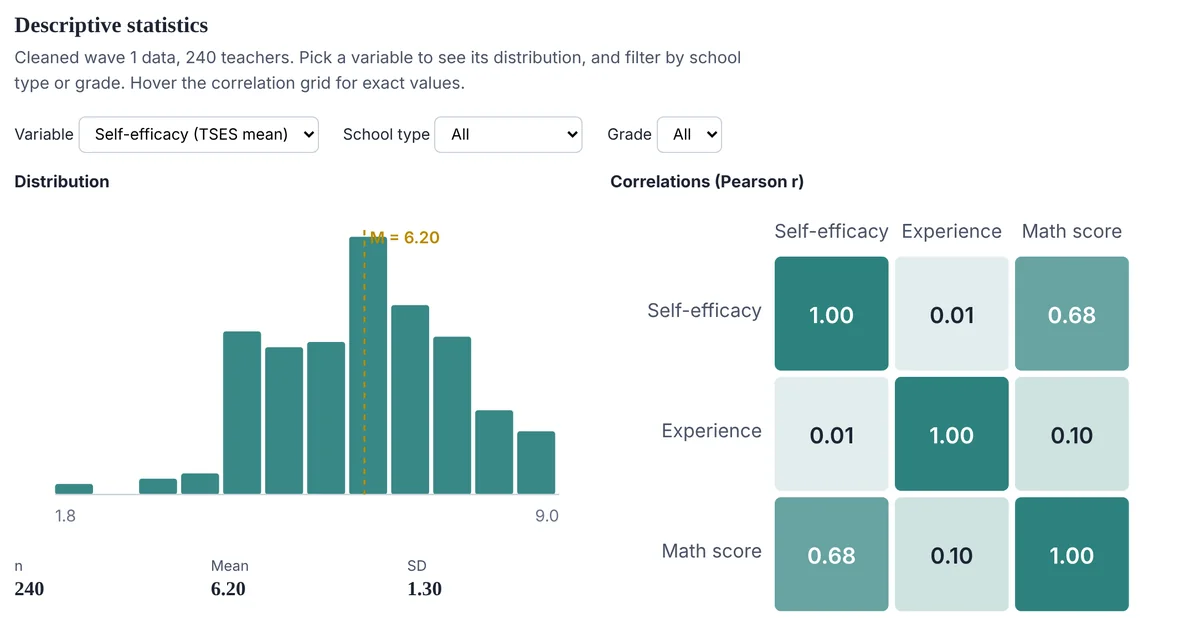
Results you can click through, with plots, assumption checks and APA tables ready for your committee.
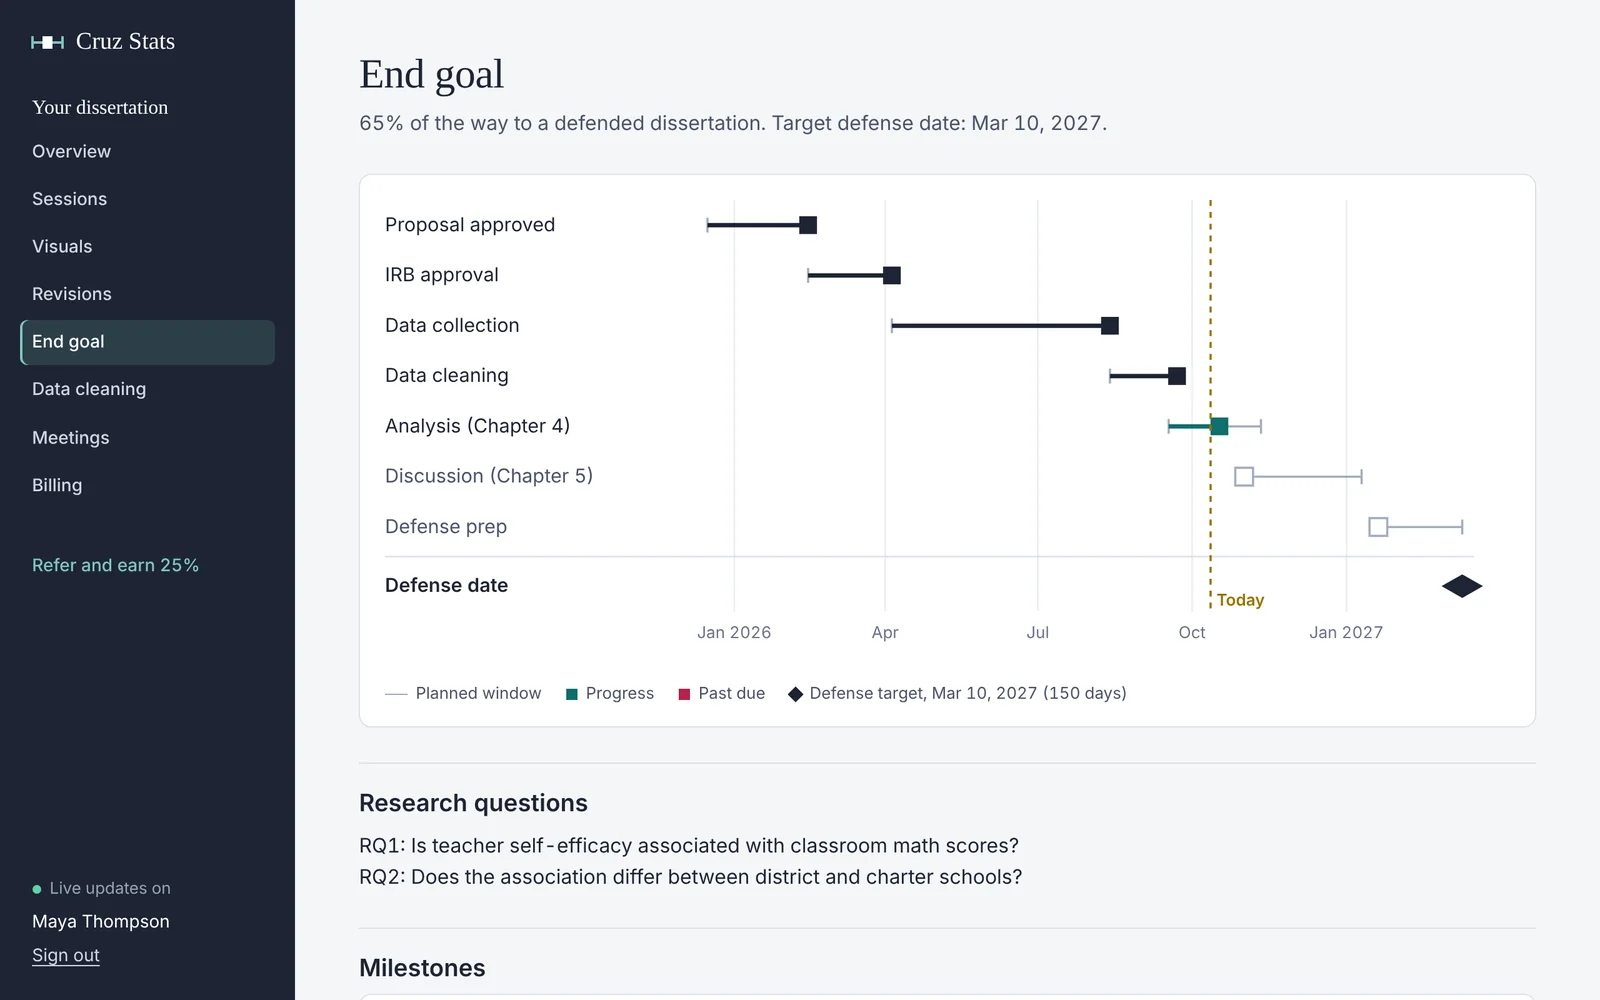
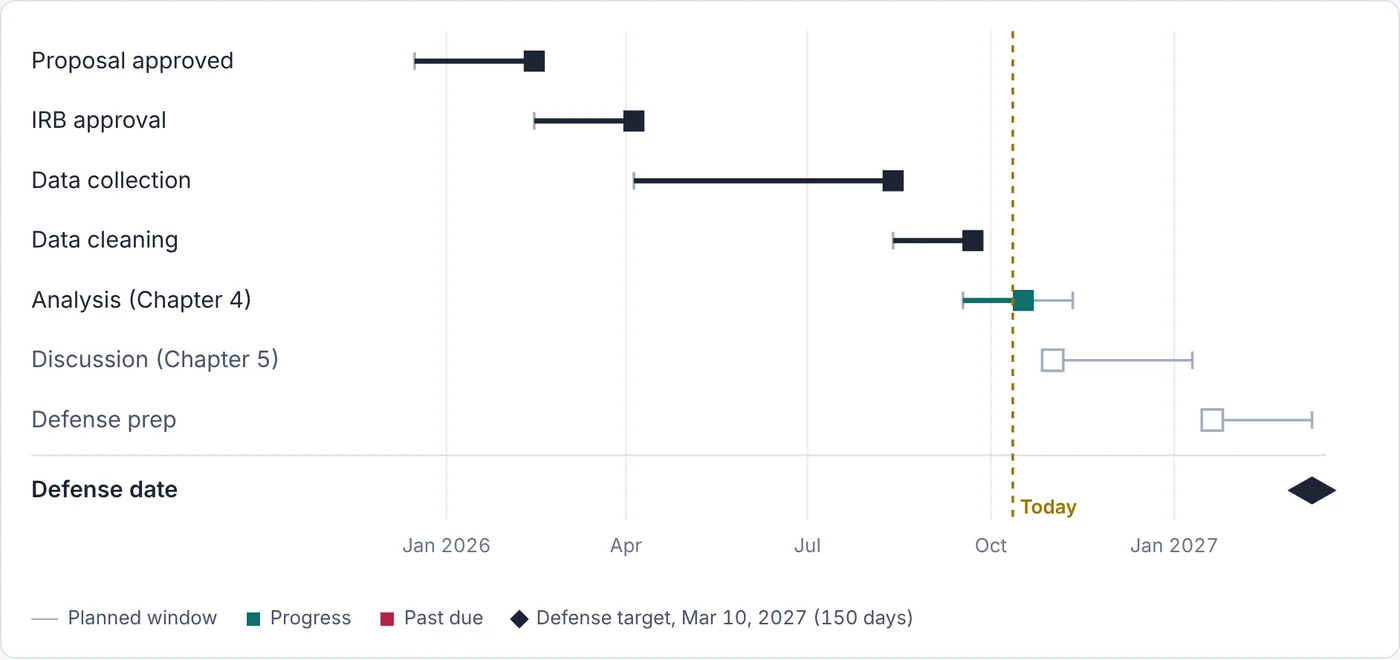
Your milestones on one timeline, from proposal approval to defense date, so you always know where you stand.
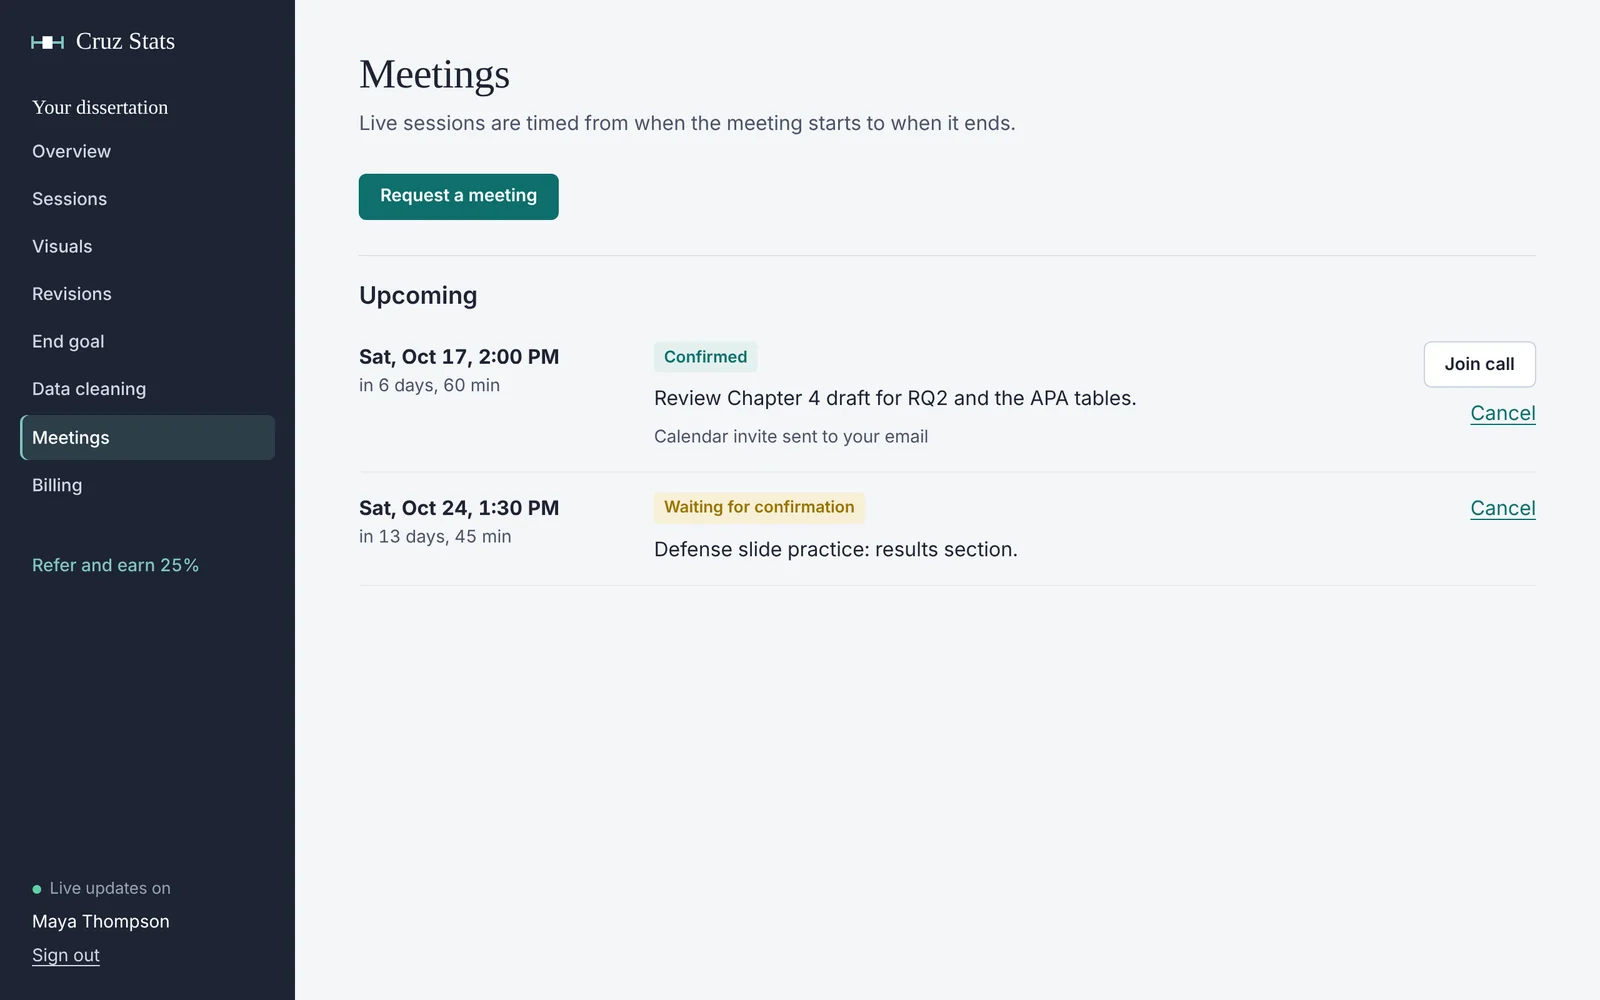
Request a time and get a Google Calendar invite with a Meet link. Sessions are timed from start to end.
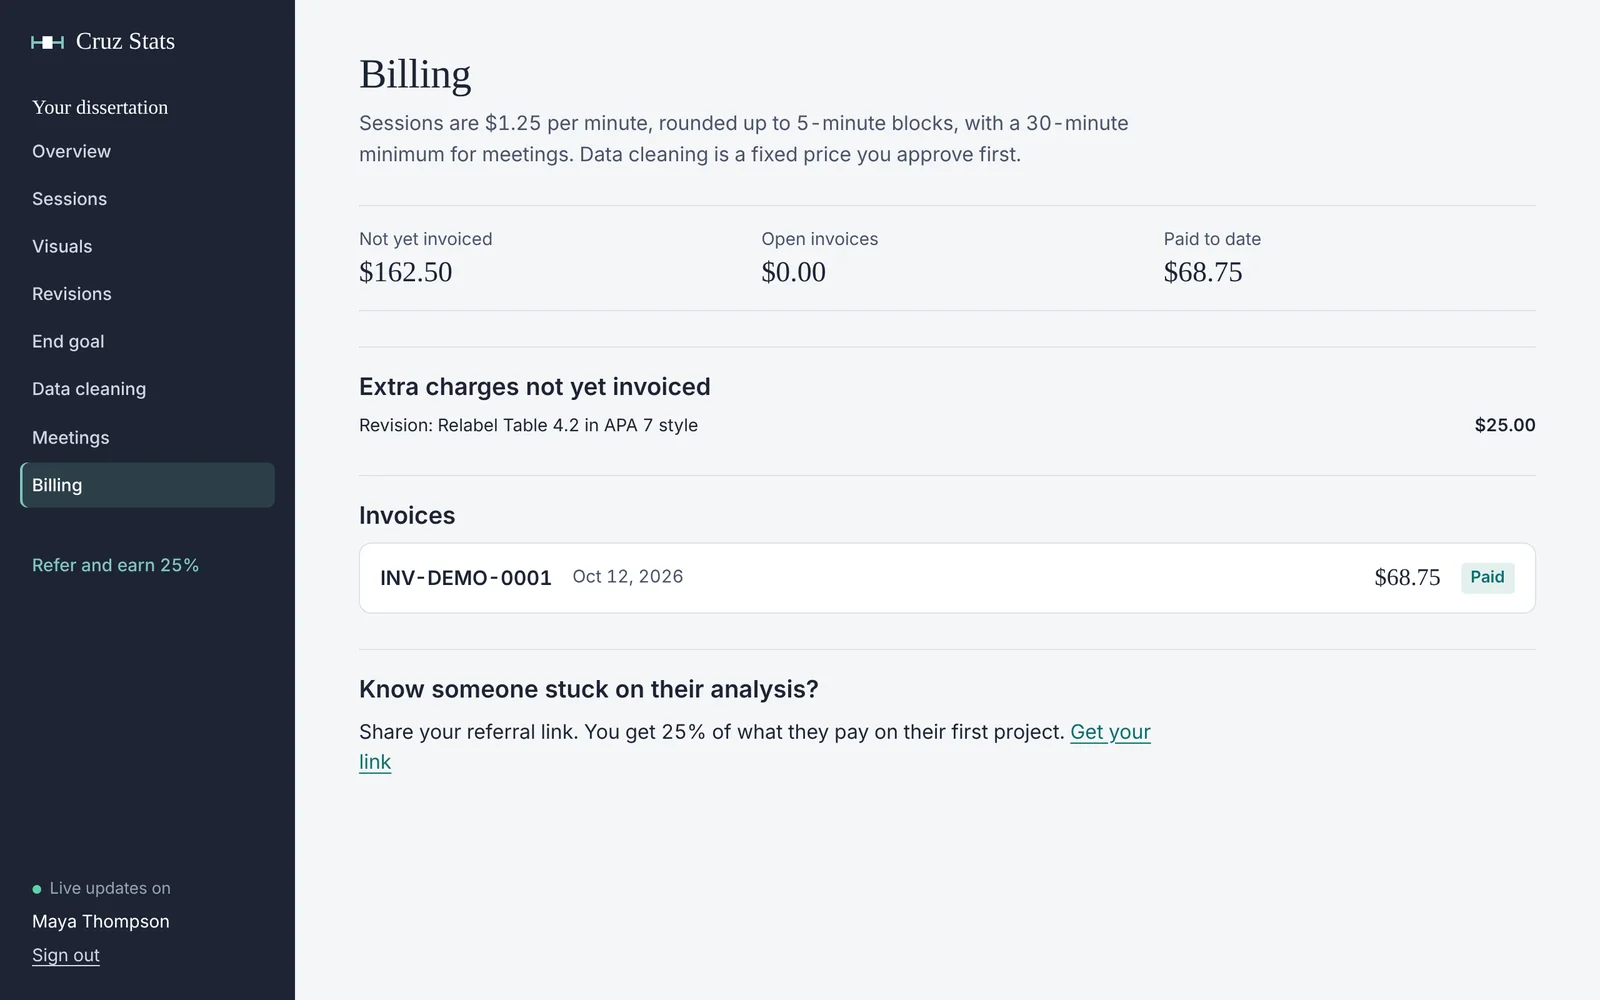
Every minute itemized. Data cleaning is a fixed quote you approve before any work starts.
How working together goes
Free consultation
Tell me about your study and where you’re stuck. If I’m not the right fit, I’ll tell you.
A plan and a price
You get a clear plan. Bigger jobs, like cleaning a dataset, come with a fixed quote you approve first.
Work in sessions
We meet over Google Meet. Notes, results and reports show up in your portal after each session.
Defend with confidence
You understand every number, because I explain each one as we go.
Pay for the minutes you use
No retainers or packages. The session timer runs in your portal, so you see the time as it happens.
- First consultationFree
- SessionsRounded up to 5-minute blocks, with a 30-minute minimum for meetings
- Data cleaningA fixed quote based on the work your files need, approved by you before I start
- ReferralsSend a classmate. You get 25% of what they pay on their first project.
Hi, I’m Jonathan
I’m a data scientist and a computer science teacher in New York City. I’ve taught statistics, so explaining it is half of what I do.
I studied computer science at Lehman College and I’m earning an MS in Data Science. I work in Python, R, SPSS and Stata, and I build every client their own portal so nothing about their analysis is a mystery.
Your dissertation stays yours
I design, run, check and explain the statistics. You write it and defend it, knowing what every number means.
Your data stays private
Send de-identified data. Files go to private storage and open only through links that expire within minutes.